The reason we only have nine more years to achieve deep emissions reductions
The UN Emissions Gap Report 2021 released on October 25, 2021, confronts us with the reality that, with only nine years remaining, the world’s largest emitting countries are not remotely on track to achieve the very deep emissions reductions that are required by 2030 to avoid the gravest impacts of climate breakdown.
It was not until December 2015, when the Paris Agreement was negotiated, that countries, including Canada, agreed “to pursue efforts to limit the temperature increase to 1.5°C.” Recognizing that the newly stated 1.5°C goal would require much deeper and faster changes in energy policy, the parties to the Paris Agreement in 2015 requested that the IPCC prepare a Special Report on the impacts of warming to 1.5°C and on the measures needed to meet that goal. Three years later, on October 7, 2018, the IPCC Special Report on Global Warming to 1.5°C was published. It provided the results of comprehensive research about the magnitude of the emissions reductions that would be required to keep the warming increase to 1.5°C.
The IPCC Special Report on Global Warming to 1.5°C
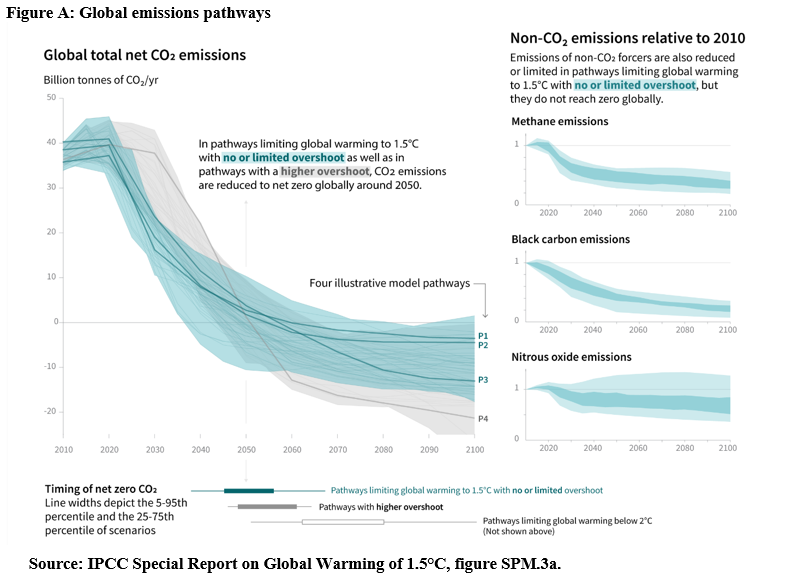
One core finding reported in the Special Report was that all releases of CO2 into the atmosphere must reach “net-zero” by 2050 to give us a 66% chance of reaching the 1.5°C goal. “Net-zero” means that, beyond 2050, no additional CO2 can be safely added to the cumulative amount of CO2 that by then will already have been released into the atmosphere. A second core finding was that to give us a realistic chance to achieve the goal of net-zero by 2050, the annual level of global emissions must be reduced 50% below the 2018 level by 2030. The Summary for Policy Makers includes this helpful graph, which depicts the massive cuts required to avoid a catastrophic outcome, reproduced here as Figure A:

The total annual level of global emissions is given on the vertical axis of the graph, measured in billions of tonnes of carbon dioxide per year (GtCO2). The global total shown for 2020 is a little over 40 GtCO2. Carbon dioxide (CO2) emissions are represented on the main graph on the left.
Total greenhouse gas emissions in 2019 were 51.5 GtCO2eq. CO2 accounts for most human caused GHG emissions, more than 70% of the total (the other approximate 30% of human caused emissions comprise methane and other GHGs).
Four mitigation pathways are highlighted, which are identified as P.1, P.2, P.3. and P.4. Each offers a different combination of energy policy, technologies, and land use strategies to achieve the hoped-for “net-zero” outcome by 2050. Importantly, each of the depicted pathways relies on deploying Carbon Dioxide Removal methods (CDR) to a different degree.
P.1 is described in the report as a mitigation plan aimed to reach “net-zero” by 2050 with minimal reliance on CDR technology. The Summary Report says this about the P.1 pathway: “Afforestation is the only CDR considered; neither fossil fuels with CCS nor BECCS are used” (emphasis added). “Afforestation” refers to large-scale projects that plant new forests and expand existing forest cover, and includes other changes to land use, restoration of wetlands, and changes in agriculture that would enhance the natural capacity of the earth’s surface to absorb carbon from the atmosphere. P.1 does not depend on future large-scale deployment of other envisioned future CDR technologies, such as BECCS or other direct air removal schemes. Under P.1, CO2 emissions decline to 20 GtCO2 by 2030.
If we fail to meet the 2030 target, or choose not to, our last resort will be to attempt later to use CDR technologies on a very large scale to remove the accumulated “residual emissions” from the atmosphere.
The significance of the atmospheric carbon concentration level
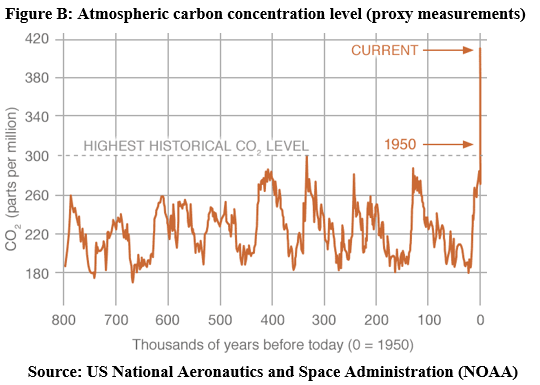
The atmospheric carbon concentration level is the metric that explains why the timeline to arrest the further expansion of oil production – and to achieve deep cuts in our consumption of oil, coal, and natural gas – is brief and unforgiving. It records the rising concentration of CO2 and other GHGs in the upper atmosphere that are driving the heating of the earth’s atmosphere, measured in parts per million (ppm).
The most recent measurements of the atmospheric carbon concentration level warn us of the unforgiving timeline we face. Each year the atmospheric CO2 concentration follows a cycle. April and May are the high points of the year, September the low. But the annual averages are moving up every year. Eight years ago, in 2013, the annual average was 395.3 ppm.
The annual average for 2020 was 413.2 ppm CO2. In May 2021, the monthly average recorded at Mauna Loa reached 419 ppm. The monthly averages in April and May are a harbinger of where we are going. Figure B represents the long-term record for the atmospheric carbon concentration over the past 800,000 years. It places our predicament in context:

During the past 12,000 years from the end of the last Ice Age until the advent of the industrial age, the atmospheric carbon concentration was stable at about 280 ppm. By 1958, it was 315 ppm. Since then, it has risen by another 90 ppm.
The rate of annual increase has been accelerating, reflecting the persistent annual growth in volume of global emissions from burning coal, oil, and natural gas. In the 1960s, the rate of growth of the atmospheric carbon concentration level was about 0.6 ppm per year. Just a decade ago in 2008 and 2009 the annual increases ranged between 1.59 ppm and 2.02 ppm. It is now rising at an average of 2.5 ppm every year.
To stay within the 2°C warming threshold, the atmospheric carbon concentration level must be kept below 450 ppm. The threshold for 1.5°C is 430 ppm. At the present rate of increase, which is now about 2.5 ppm every year, the atmospheric carbon concentration level will exceed 450 ppm CO2 by about 2035. It is on track to rise above 430 ppm CO2 before the end of this decade.
We are in a race to reduce the magnitude of the annual increases in the atmospheric carbon concentration. If we do not act now, it will continue to rise about 2.5 ppm every year for another nine years, and on into the next decade. Every month, and every additional year we delay the start of deep cuts in oil production (and in coal and natural gas use), we are worsening humanity’s fateful dependence on the future viability of vast technology schemes which at present do not exist or exist only in small scale experimental forms.